 RockCloud-基石云安全-官方博客
The data in the console actually falls into two layers. Distinguish them first, and troubleshooting won't take a detour:
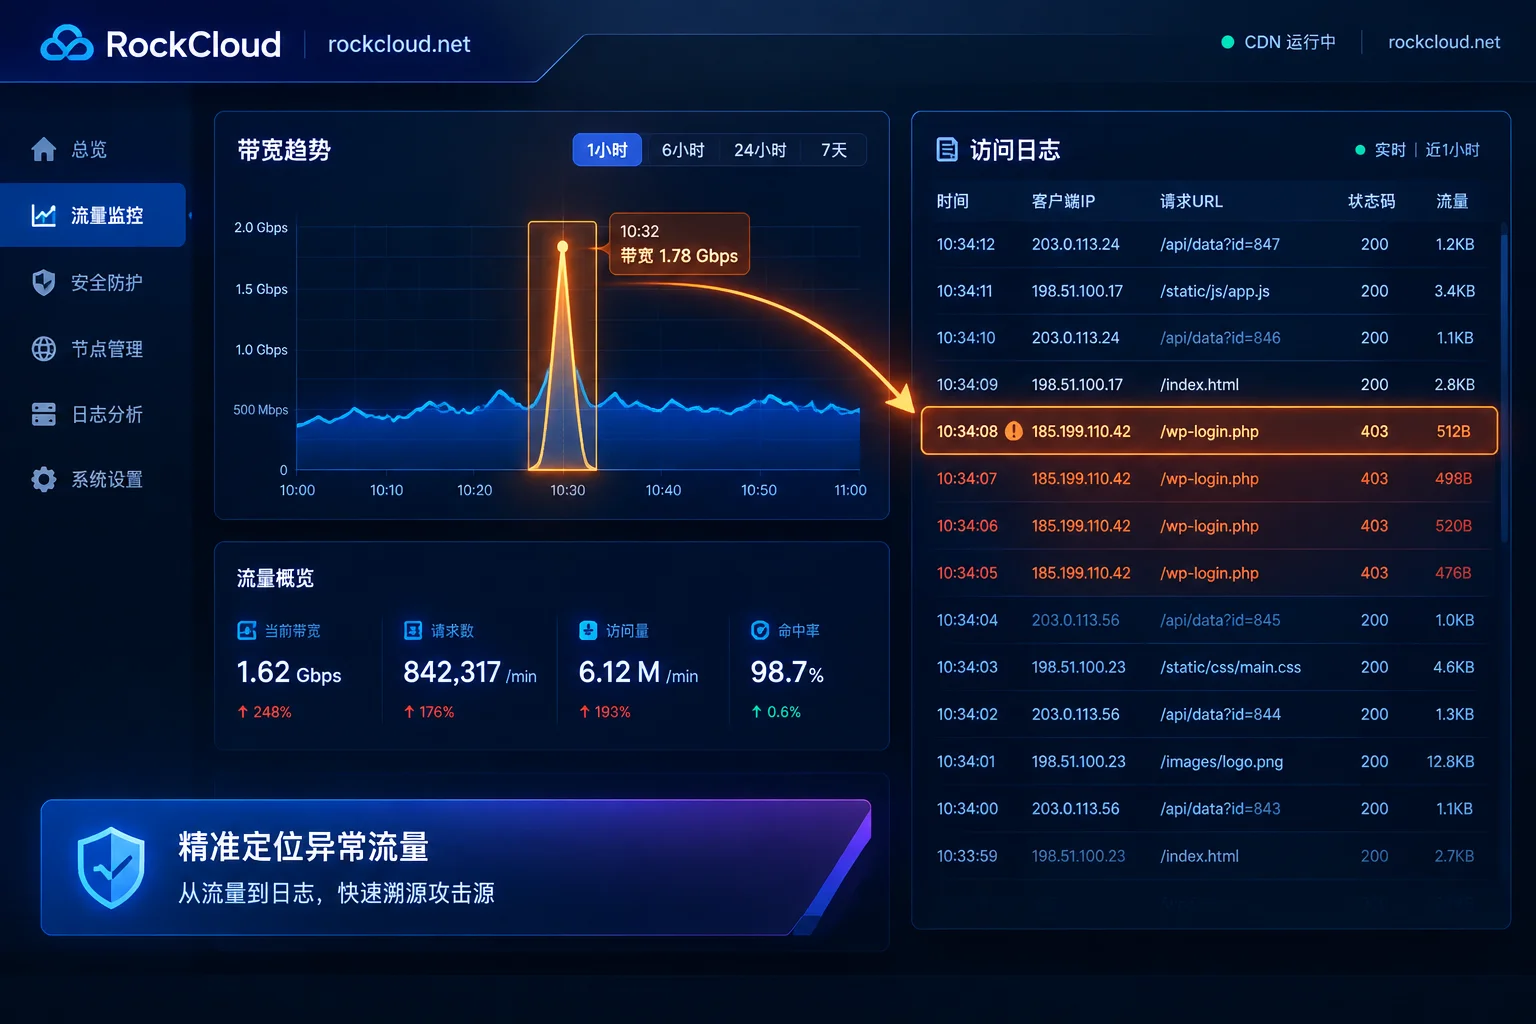
- Monitoring dashboard (aggregated metrics): bandwidth, traffic, request count, hit rate, status code proportions. It answers "when did it spike, by how much, and on which type of response".
- Network logs (raw details): client IP, URI, status code, Referer, UA, latency for each request. It answers "who is requesting, what are they requesting, and where is the bottleneck".
The sequence is almost always the same: first circle the anomaly time period and dimension on the dashboard, then use these two conditions to filter logs. Doing it the other way around—digging through logs first—means you won't find the key point among hundreds of thousands of lines.
1. Three-Minute Dashboard Inspection: Check These Five Numbers in Order
Consoles typically have two sets of monitoring views. Real-time monitoring uses high-frequency sampling at 1-minute or 5-minute granularity to see current fluctuations; resource monitoring/usage statistics spans longer periods (commonly 30–90 days) for trends and monthly reconciliation. Use the former when problems are occurring, and the latter for capacity and cost decisions.
Scan through in this order:
- Bandwidth peak (Mbps/Gbps): First confirm which 5-minute point the spike occurred at, and note the time. This time point becomes the filter condition for subsequent log searches.
- Total downstream traffic: If traffic increases significantly but the bandwidth curve is flat, it indicates sustained pulling; if there are spikes in bandwidth but the total volume is small, it's more like instantaneous concurrency.
- Request count / QPS: Compare this with traffic. This step directly separates two types of problems (see next section).
- Traffic hit rate: The common formula is (total downstream traffic − origin traffic) / total downstream traffic. Also pull out origin bandwidth separately for comparison.
- HTTP status code distribution: Check whether the proportion of 2xx/3xx is being squeezed out by 4xx (403, 404) or 5xx (502, 504).
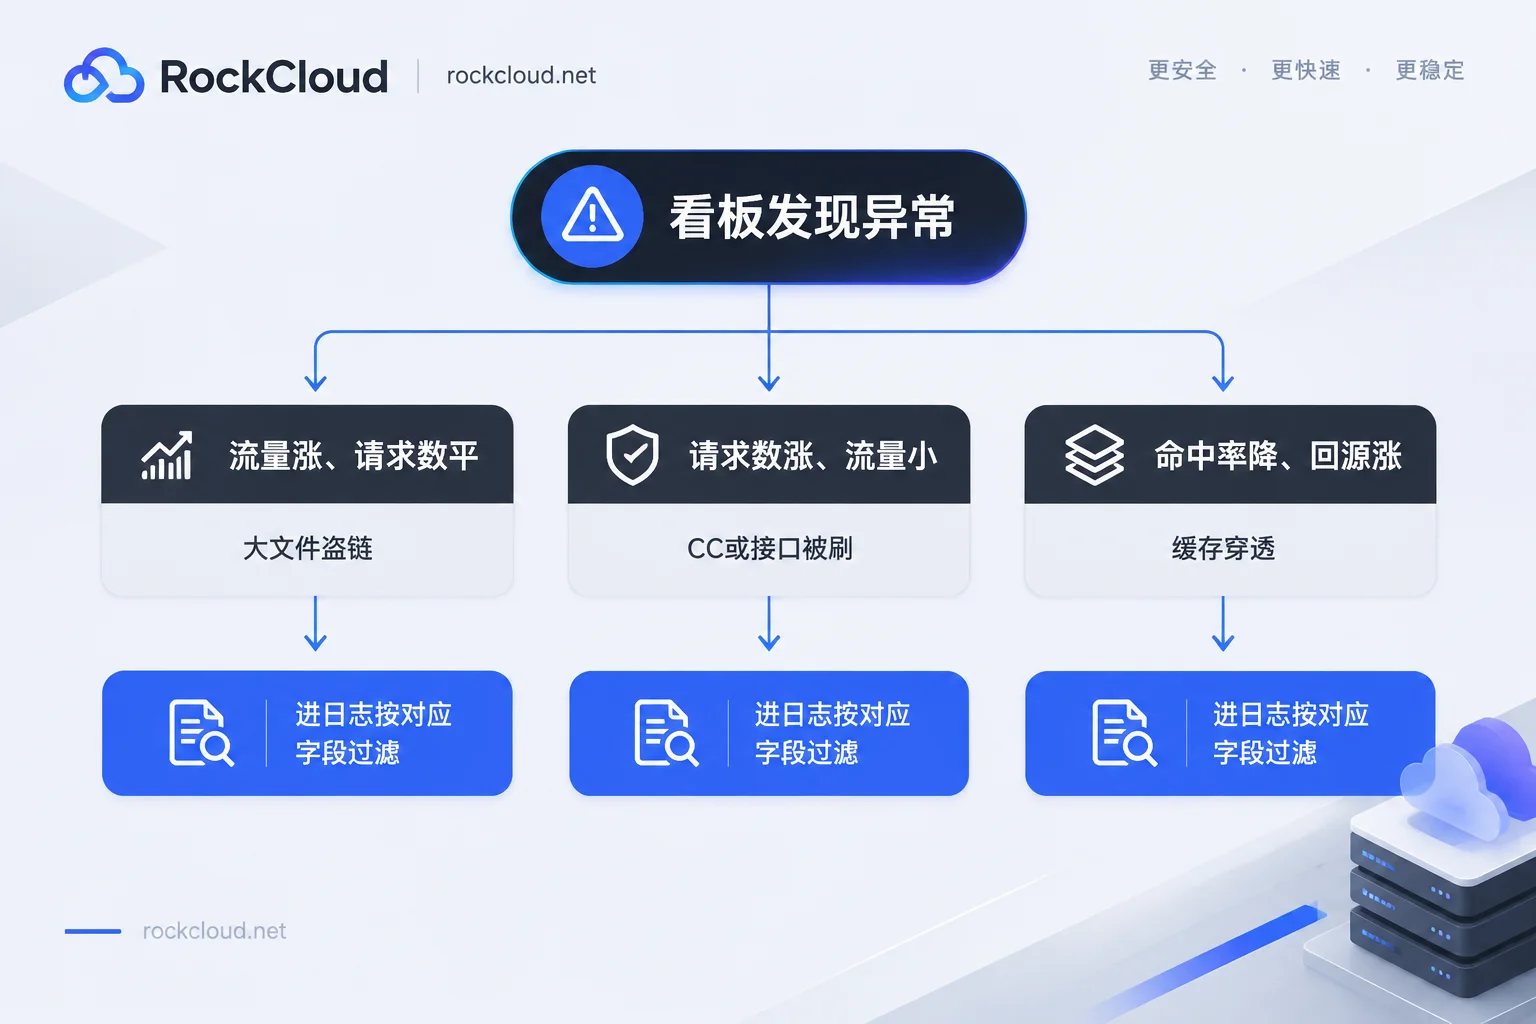
First Separate Two Types of Anomalies by the Ratio of Traffic to Request Count
- Traffic spikes, request count basically unchanged → The size per request has increased. Mostly large files (installers, videos, original images) being hotlinked or mass-downloaded.
- Request count spikes, traffic per request very small → High-frequency small requests. CC attacks, crawler clusters, and API abuse all fall into this category.
- Both increase together, hit rate drops sharply, origin bandwidth surges → Requests are not being blocked at edge nodes and are penetrating to the origin. Typical causes are cache busting with random parameters, or a recently broken cache rule. This situation requires immediate attention because all pressure is on the origin.
2. How to Get Network Logs: Real-Time Search and Offline Download
There are usually two ways to get logs from the console, with different purposes:
- Real-time log panel / log search: Latency from seconds to minutes, supports filtering by time, domain, status code, and URI keywords. Use it when handling incidents, narrowing down while watching.
- Offline access log download: Archived by hour or day into standard log files (commonly compressed access.log), downloadable locally. Suitable for post-mortem analysis, multi-day batch statistics, and monthly traffic reconciliation.
Offline logs usually have delays (from tens of minutes to several hours depending on the platform). Don't rely on them for ongoing attacks.
3. Essential Log Fields to Check
Regardless of the platform, these columns support your judgment:
| Field (common names) | What it answers |
|---|---|
| client_ip / remote_addr | Who is requesting. Aggregate by IP for Top lists to determine if it's CC, crawler clusters, or a single-machine script. |
| request_uri / uri | What is being requested. Aggregate by URL to locate hotlinked large files or abused APIs. |
| http_code / status | Who returned the error. Distinguish CDN-side blocking from origin errors. |
| referer / refer_domain | Source page. Check for unauthorized site hotlinking. |
| user_agent | Client identifier. Identify scanners, batch tools, and fake browser UAs. |
| Origin latency (upstream_response_time, etc.) | Where the slowness is. Origin processing or network jitter. |
| Cache status (HIT/MISS) | Whether the request went to origin. Use alongside hit rate anomalies. |
Field names and order vary by platform. Client IP is called client_ip on some platforms and remote_addr on others. Some platforms' log formats place latency in different column positions. Before downloading logs, find the log field description/field dictionary for that domain in the console, confirm what each column is, then write statistics commands. Otherwise, picking the wrong column with awk will lead to completely opposite conclusions.
After obtaining offline logs, the two most common statistics (replace column numbers according to actual log format):
# Top 20 高频客户端IP
awk '{print $1}' access.log | sort | uniq -c | sort -rn | head -20

# Top 20 被请求最多的URI
awk '{print $7}' access.log | sort | uniq -c | sort -rn | head -20

# 只看某个时间段的非2xx请求
grep "14:2[0-9]:" access.log | awk '$9 !~ /^2/ {print $9, $7}' | sort | uniq -c | sort -rn
To determine if an IP is malicious, don't just look at request count. Normal users through CDN also have high frequency (static resources in pages). A more reliable combination is: high request count per IP + concentrated on the same dynamic URI + single or abnormal UA + almost no static resource requests.
4. Troubleshooting Paths for Four Common Anomalies
1. Traffic for a Specific File Being Hammered
Dashboard confirms traffic up, request count flat → In logs, aggregate by request_uri to find the URLs with the largest traffic share → Aggregate these URLs by referer. If many requests have a Referer pointing to a domain not yours, it's hotlinking; if Referer is empty and client_ip is scattered, it's more like direct links being distributed. The fix is to enable anti-hotlinking (Referer whitelist) or add signed authentication for that path.
2. Hit Rate Drops Sharply, Origin Bandwidth Surges
First look at what the URIs of MISS requests look like. If the same path has constantly changing random parameters appended (?v=193847, ?t=xxx), it means the cache key is being fragmented by parameters, and every request goes to origin. Short-term fix: configure ignore specified parameters/parameter whitelist so they share one cache copy, and rate-limit source IPs. If the MISS URIs are inherently dynamic APIs, it's pure volume increase—go with rate limiting and human verification.
For handling high-frequency API abuse, refer to the layered threshold approach in How to rate limit stolen LLM API calls.
3. Sharp Increase in 403s
403 is not a single cause. First distinguish in logs who returned it:
- Check the request's Referer and User-Agent against your anti-hotlinking rules, UA black/white lists, IP blacklist—requests blocked by these rules usually have neat characteristics (same UA segment, same batch of IPs).
- Look at CDN error response headers/blocking markers (markers vary by platform, e.g., X-Tengine-Error type fields, or WAF rule ID fields). Those with blocking markers are blocked at the edge; those without are often 403s from the origin itself.
- If 403s hit normal business paths, especially callbacks, uploads, backend APIs, suspect rule false positives first.
For false positives on non-retryable paths like payment callbacks, see How to whitelist payment callbacks blocked by WAF.
4. 502 / 504
First filter records with status code 502/504 and cache status MISS, then look at the origin response latency for these records:
- Latency close to timeout threshold and gradually increasing → Origin can't keep up (database, connection pool, CPU). Scale origin or degrade first.
- Error reported with very short latency → More like connection failure. Check if origin is down, port blocked, or origin firewall blocking CDN origin IPs.
- Only some nodes/regions affected → Likely a routing issue. Break down the same time period by node or region.
5xx and attacks often occur together: origin gets overloaded, returns 504, then stops responding. At this point, don't stop at logs—immediately follow the sequence in How to quickly restore access after a DDoS attack to stop the bleeding.
5. Don't Only Open the Console When Things Break
Two things worth setting up in advance:
First, alerts and push notifications. Set threshold alerts for bandwidth peak, 5xx proportion, and hit rate, and push them to where you'll actually see them. RockCloud's console provides a log panel and Telegram data push, so you don't have to manually watch for abnormal curves; specific panel capabilities and node distribution can be confirmed on the CDN and Nodes page.
Second, understand which number on the dashboard corresponds to billing. Traffic-based billing looks at total downstream traffic; peak-based billing looks at bandwidth sampling points—the same curve can cost very different amounts under the two billing models. RockCloud uses fixed peak billing with unlimited traffic, so during inspections, the key is whether bandwidth peak hits the plan limit, not total monthly traffic. The differences between three peak algorithms (5-minute sampling points, monthly 95th, fixed peak) are detailed in How peak-based billing works for high-defense CDN.
Final reminder: A spike on the dashboard is not necessarily an attack. Promotional pushes, app version updates, crawler scraping, and misconfigured monitoring probes can all cause the same curve shape. First confirm the request source and content in logs, then decide whether to scale up, add cache rules, or block.


Comments(0)